What is missed savings analysis in corporate travel?
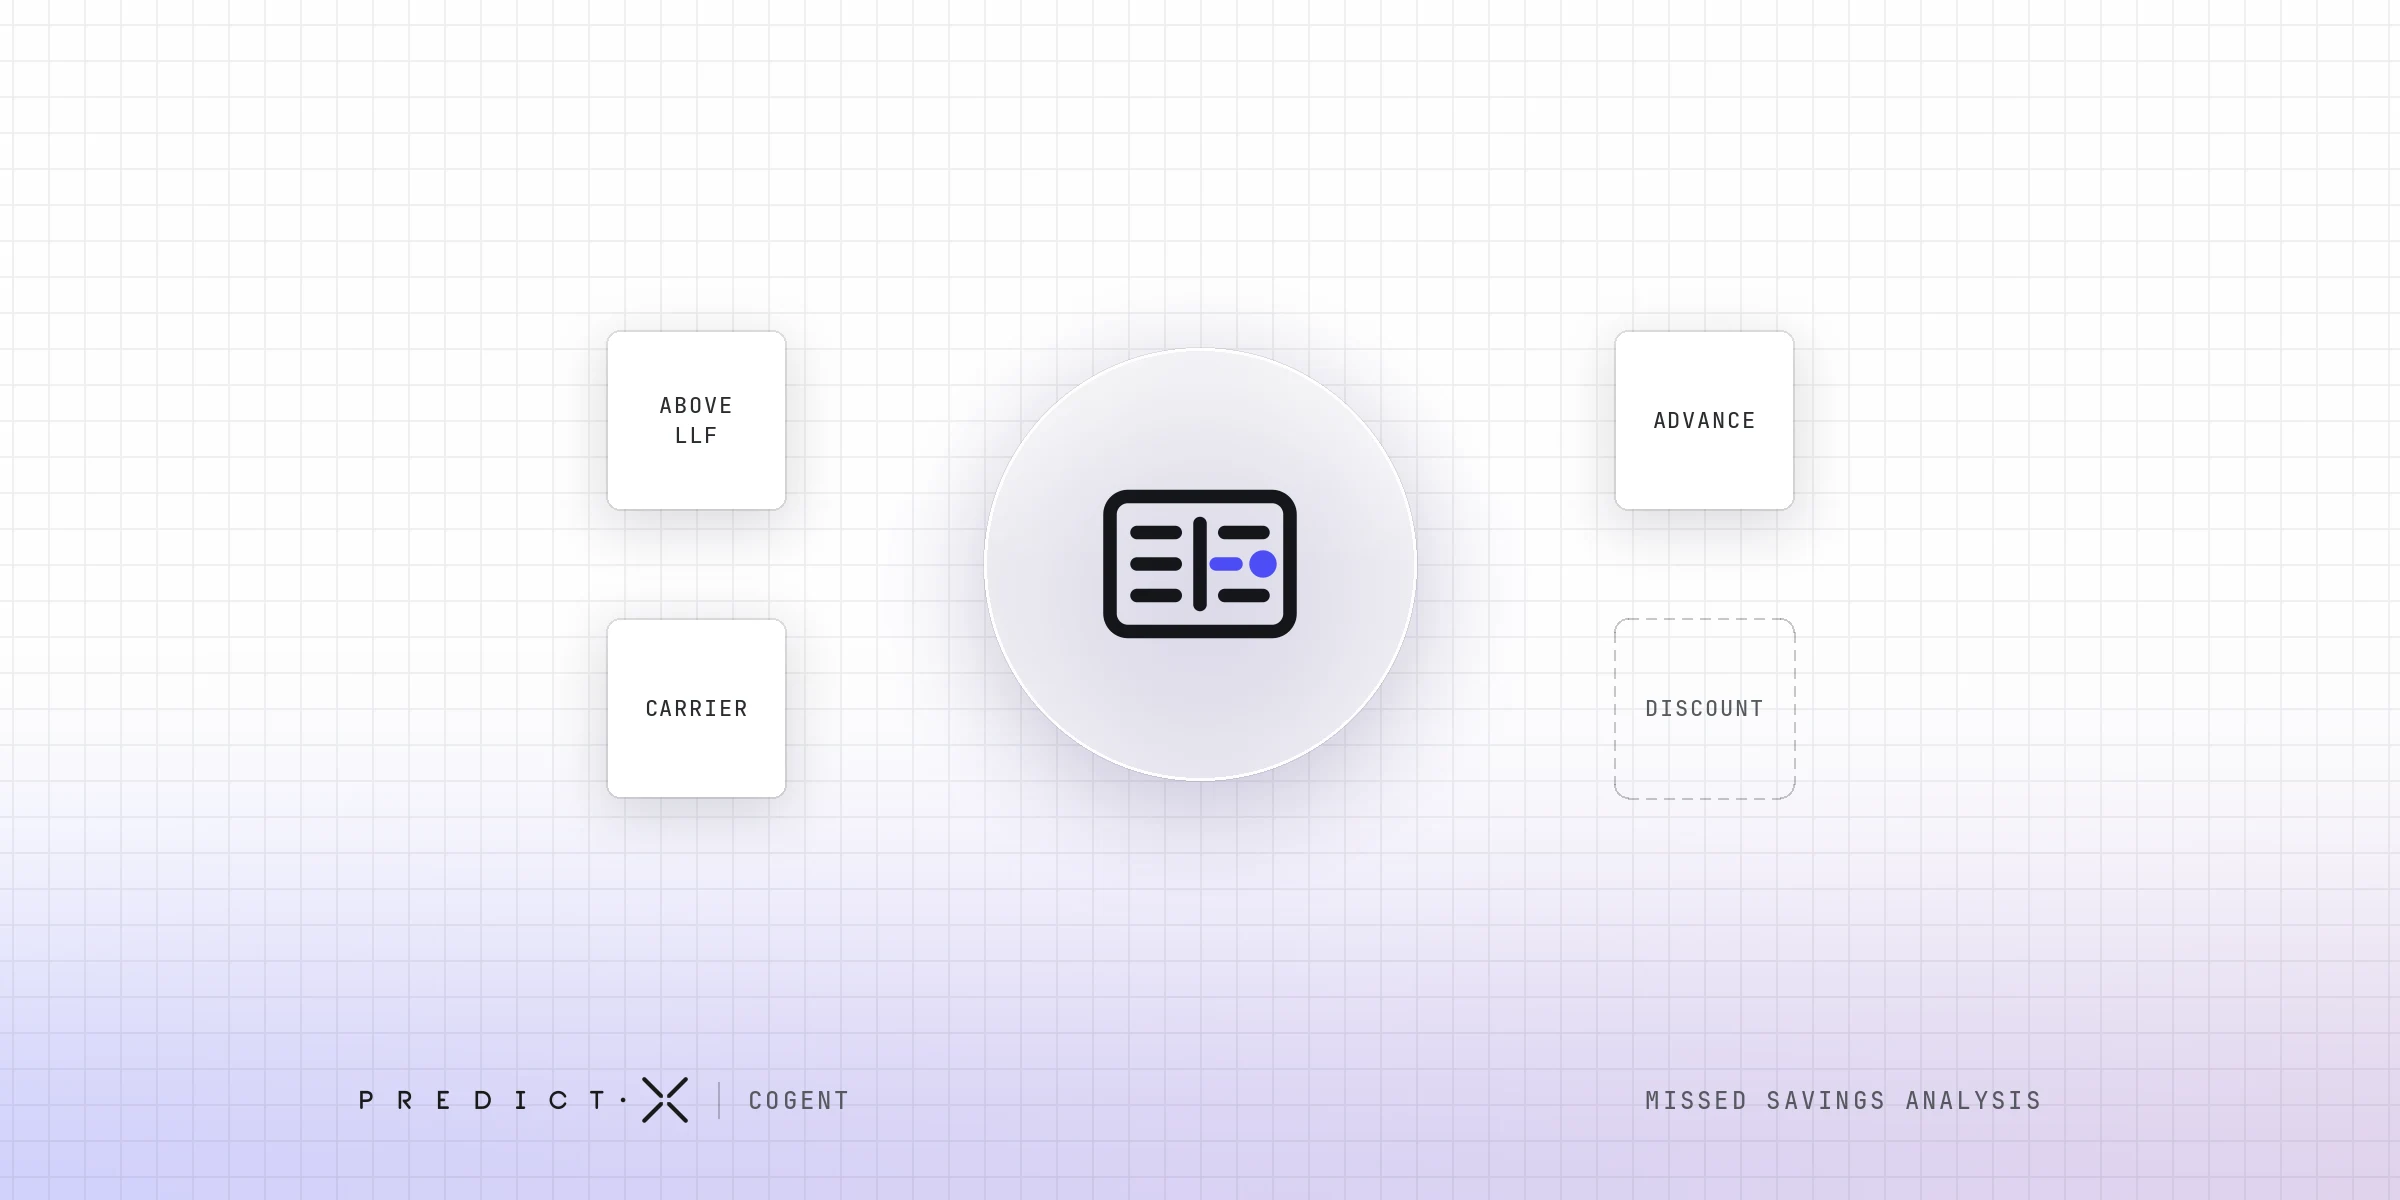
Missed savings analysis is the practice of measuring the gap between what a travel programme actually paid and what it could have paid, using booking data, fare benchmarks, contract terms and policy parameters together. In corporate air travel it covers four leaks: fares above lowest logical fare, non-preferred carriers, missed advance-purchase windows and discounts below their contracted target.
Missed savings sit across four systems owned by three teams, which is why the figure is so rarely ready before the quarter closes. Run by hand, the analysis needs those sources exported and joined first, and the answer tends to land after the fares have gone.
Most travel and expense reporting stops at what was spent. Measuring what could have been spent is the capacity gap behind the shift to agentic AI in corporate travel, because the work is a join across systems rather than a lookup in one.
This guide breaks the gap into four measurable leaks, sets out a five-step method, works one policy simulation through to a figure, and gives a four-stage maturity model for placing your own programme.
In this article
- Why does missed savings stay invisible in travel and expense reporting?
- What actually counts as missed savings?
- How does missed savings analysis work?
- How does missed savings analysis prepare a carrier renewal?
- What are enterprise teams actually asking?
- What does one policy simulation really save?
- How mature is your missed savings analysis?
- Which approach surfaces missed savings fastest?
- Frequently asked questions
- Where to start with missed savings analysis
Why does missed savings stay invisible in travel and expense reporting?
Missed savings stays invisible because answering it requires joining four data sources owned by three different teams: booking data from the travel management company (TMC), fare benchmarks from the market, contract terms from procurement and policy parameters from finance.
No single system holds all four. The TMC sees what was booked, and procurement holds the discount targets without the transaction detail. By the time someone reconciles them, the quarter has closed.
Four reasons the number never gets produced:
- Ownership is split: three teams hold one answer between them, and none owns the join.
- Prep time is the real cost: every run starts by exporting and matching the four sources by hand, before any analysis begins.
- Benchmarks decay fast: a fare comparison is only valid against the market on the booking date.
- The output arrives late: a retrospective figure changes nothing about next quarter's bookings.
Cost pressure raises the stakes. Global business travel spend is forecast to reach a record $1.71 trillion in 2026, according to GBTA's Business Travel Index Outlook (August 2026), and in a GBTA poll published in January 2026, 74% of US travel buyers named programme cost savings and control as a concern, against 62% elsewhere.
What actually counts as missed savings?
Missed savings breaks into four measurable components: bookings above lowest logical fare, non-preferred carrier use where a preferred carrier was available, missed advance-purchase windows, and negotiated discounts underperforming their contracted target.
Each is measurable on its own. Together they form what we call the Four Leaks Framework, and naming them matters because each routes to a different owner and a different fix.
The Four Leaks Framework
The table sets out where each leak shows up in the data and which sources answer it.
Bookings above lowest logical fare and missed advance-purchase windows are policy problems for whoever owns the travel policy. Non-preferred carrier use is a channel problem for the travel manager. Discount underperformance is a contract problem for procurement.
Blending the four into one savings number hides which lever to pull.
How do you measure bookings above lowest logical fare?
Lowest logical fare (LLF) is the cheapest fare that still satisfies policy and practical routing constraints. Measuring against it means matching each booking to the LLF available on that route and date, then totalling the difference across every ticket booked above it.
Enforcing LLF at the point of booking is one control. Measuring what bookings above it cost over a quarter is the analysis.
How does missed savings analysis work?
Missed savings analysis runs in five steps: consolidate the feeds, resolve the benchmark, score every booking against policy, attribute the gap by owner, and run the brief again in a new thread whenever the question changes.
The difference from a quarterly report is that each step is automated and none waits on a ticket queue. Agentic analytics, meaning AI that plans a task and carries it out across systems rather than answering from one, handles the join that used to need three teams. That matters because the analysis is only useful while the fares are still bookable.
How it works, step by step:
- Consolidate the feeds: booking, card, expense, HR and finance records are unified so one query can reach all of them.
- Resolve the benchmark: each booking is matched to the compliant fare that was available on that route and date.
- Score against policy: every transaction is tested against your own policy parameters and negotiated rates.
- Attribute the gap: the variance is broken out by carrier, corridor, business unit and traveller, so each number has an owner.
- Re-run in a new thread: when the question changes, run the same brief in a new thread on today's data.
A missed savings figure that arrives after the booking window has closed can only describe the past.
How does missed savings analysis prepare a carrier renewal?
Missed savings analysis prepares a carrier renewal by giving procurement analytics for T&E sourcing the figure it has always lacked: where realised spend fell short of contracted terms, per carrier and per corridor, before the negotiation opens.
Invoice data alone can show what was bought. It cannot show what should have been bought at the rate already negotiated.
In air sourcing especially, walking into a renewal with realised discount performance by corridor turns the conversation from an assertion into an audit.
Three questions missed savings answers before a renewal:
- Which carriers underperformed their contracted target, by how much, and on which corridors?
- Where did volume commitments go unmet, and what did that cost against the tier we were promised?
- Which routes justify reopening the contract now, rather than at the next annual air sourcing cycle?
What are enterprise teams actually asking?
Enterprise teams ask a specific question about a specific corridor or carrier, and expect the breakdown attached.
The query patterns below are drawn from live enterprise deployments of Cogent, our travel and expense management software, with route, region and business-unit names removed. PredictX does not name a client without its written permission. The deployment figures in this article were produced by Cogent from each organisation's own travel and expense data for the period stated, and are held with their method in our evidence records.
At a global industrial enterprise, one route-level query returned 83 tickets, with their total spend and average fare. A three-year carrier breakdown at a global industrial enterprise returned air spend by year and by carrier.
Briefs that produce a missed savings answer:
- "Show missed savings by carrier for this region, broken down by business unit."
- "What is the average ticket price on this route for this business unit versus the peer benchmark?"
- "Show all single tickets above $10,000 and evaluate against lowest logical fare policy."
- "Break down three-year carrier spend by year and by carrier."
- "Which corridors are below their contracted discount target this quarter?"
Each names what to measure, over what scope and how to group it, which is why each returns a figure someone can act on.
What does one policy simulation really save?
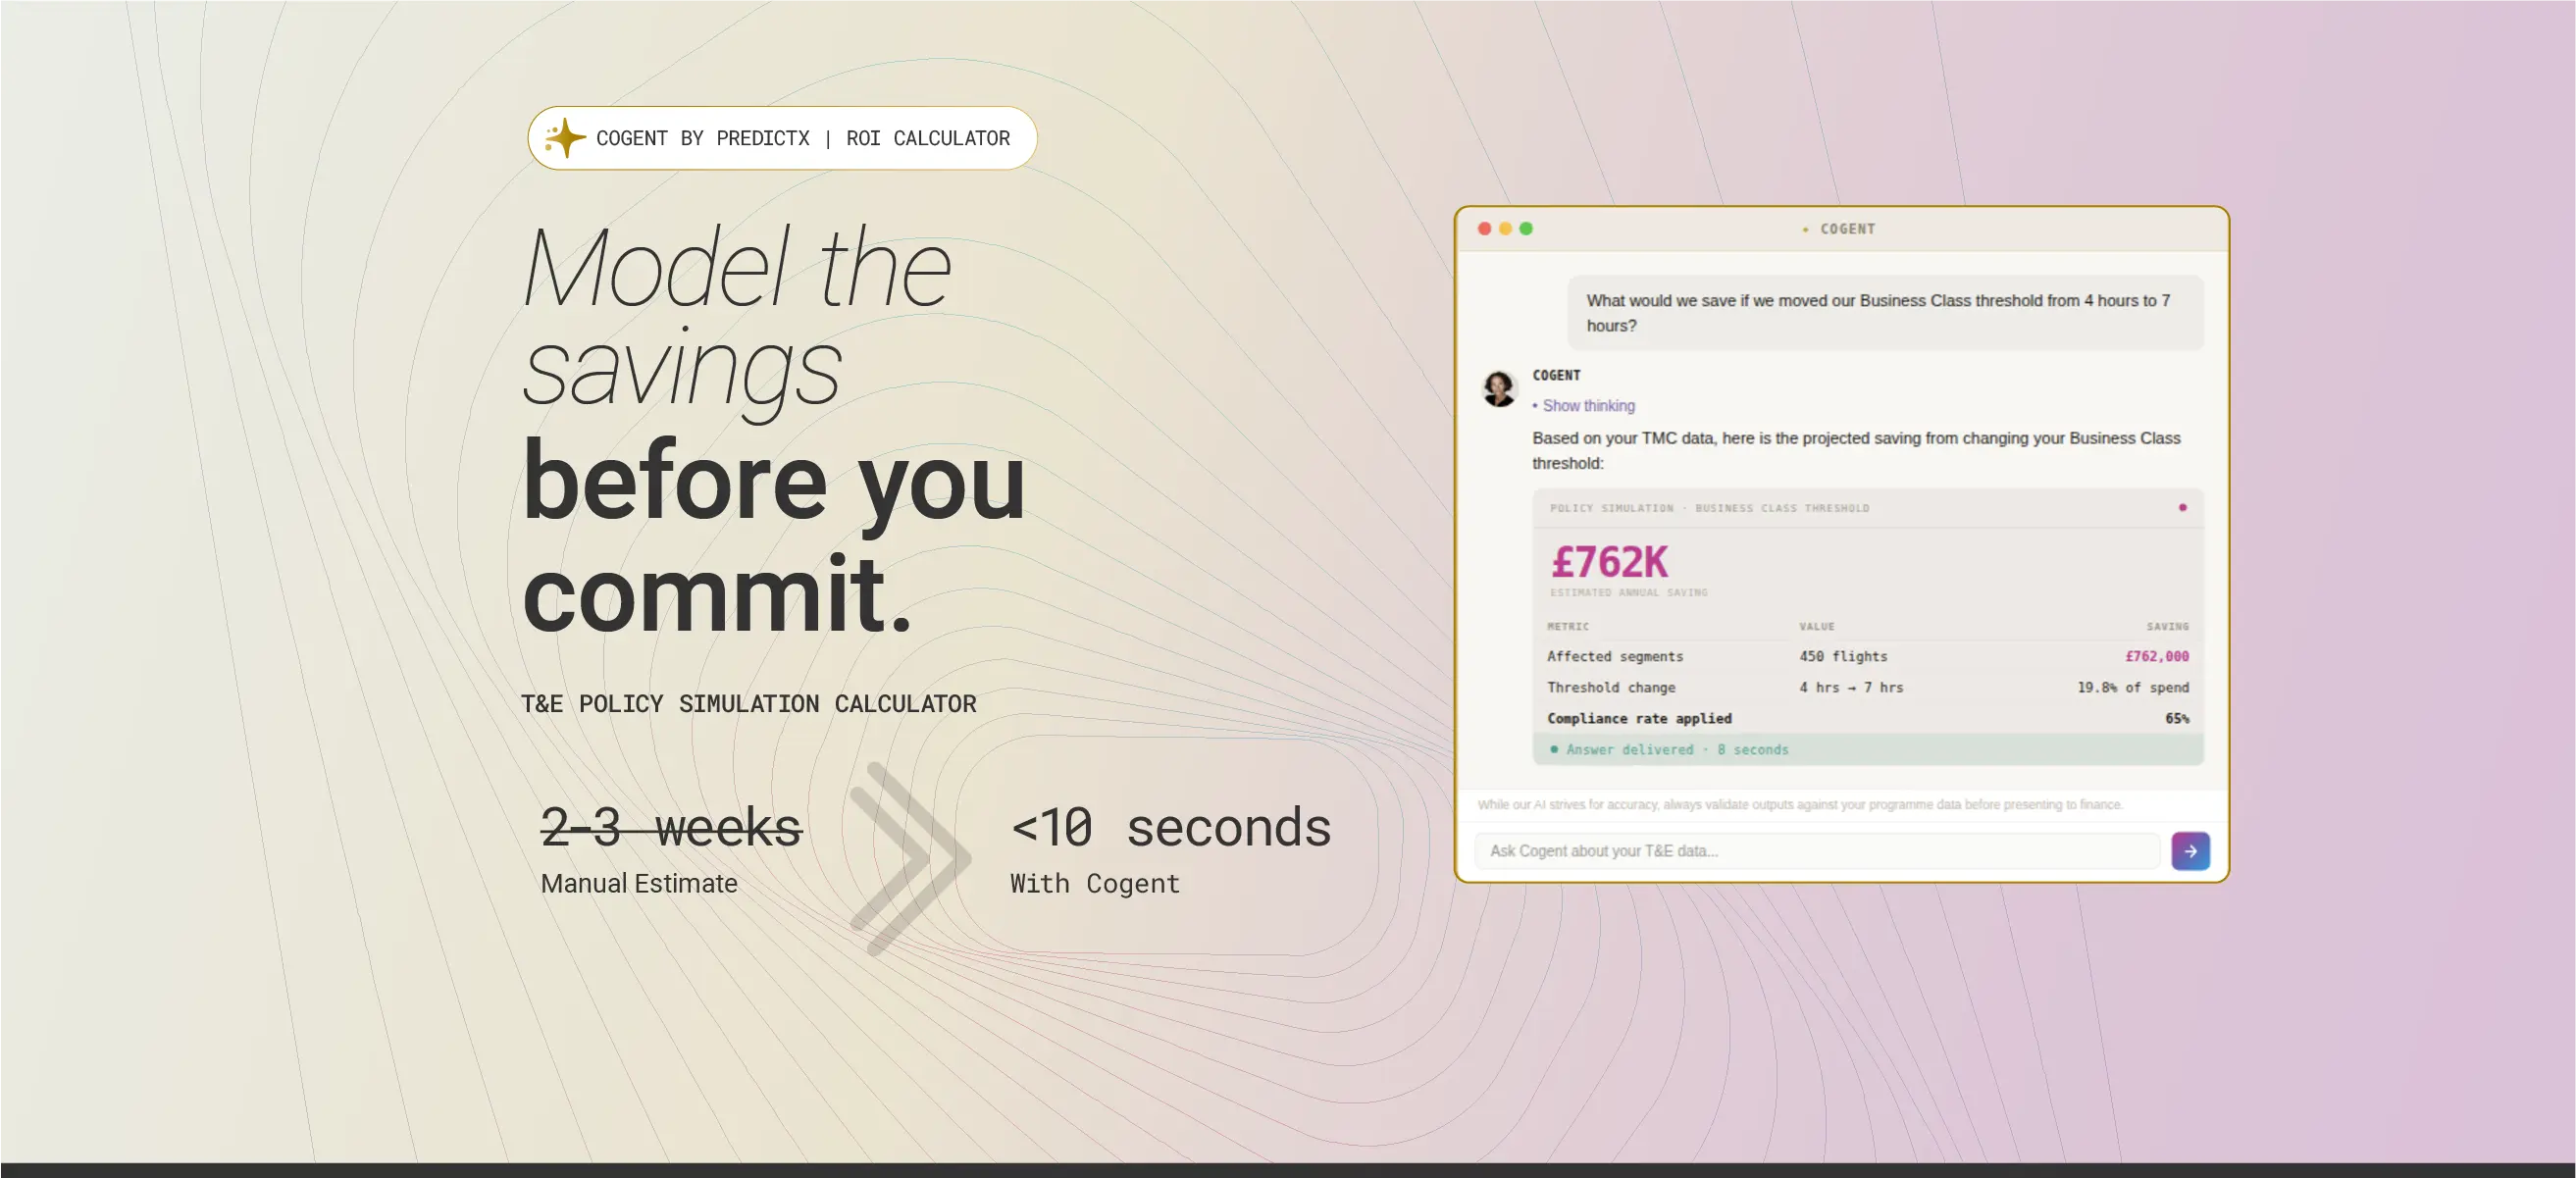
A single threshold change on long-haul Business Class eligibility can release a six-figure annual saving. Built by hand, the simulation takes two to three weeks of analyst work in a mid-to-large enterprise, on PredictX's step-by-step estimate; with agentic analytics it takes seconds, based on enterprise deployment patterns, individual results vary.
Take a worked model from the PredictX T&E policy simulation calculator. A programme flying 1,200 long-haul flights a year, at an average Business Class fare of £3,200 and an average Economy fare of £600 on the same routes, moves its eligibility threshold from four hours to seven.
If 26% of those flights fall between four and seven hours, 312 segments are affected. At 65% traveller compliance, 203 of them switch to Economy, and the calculator returns a projected saving of £527,800 a year: 13.7% of the £3,840,000 spent on long-haul Business Class.
The figure can be produced, challenged and re-modelled inside one conversation, before anyone commits to a policy change. Lower the compliance assumption to 50% and the saving falls to £405,600 a year, which is the challenge a finance lead is likely to make.
How mature is your missed savings analysis?
Missed savings maturity runs in four stages, from spend reporting to continuous quantification. A programme that can report what was spent, but cannot say what could have been spent without commissioning an analyst, sits at stage two.
The Missed Savings Maturity Model
Read the middle column and find the row that describes your programme last quarter.
A compliance flag with no monetary value attached is stage two, however sophisticated the dashboard looks.
Stage four rarely needs new data, because booking, fare, contract and policy records usually exist already. It needs the join across them, which is the step agentic analytics automates.
Which approach surfaces missed savings fastest?
Only continuous quantification produces a missed savings figure while the fares are still bookable. Quarterly analyst review and dashboard reporting both deliver the answer after the decision window has closed.
The table compares four ways of producing a missed savings figure across coverage, speed and traceability. Coverage counts how many of the four leaks each approach can measure at all.
The consultant audit is thorough and useful once a year. It cannot tell you, on the Tuesday of a negotiation week, where a carrier stands against its contracted target.
If your missed savings figure cannot be produced during the negotiation itself, it is not a negotiation input. It is a post-mortem.
Sources behind the numbers
Each figure below is cited to its original publisher.
Cost pressure is rising while the tooling to answer cost questions is changing at the same time.
Frequently asked questions
How do I calculate missed savings on business air travel?
Calculate missed savings by scoring every air booking against four benchmarks: the lowest logical fare on that route and date, the preferred carrier, the advance-purchase window and the contracted discount. Total the gap on each leak separately, then attribute it by carrier, corridor and business unit, so every figure has an owner.
How is missed savings analysis different from a compliance report?
A compliance report flags that a booking broke policy. Missed savings analysis attaches a monetary value to that breach and attributes it. Compliance shows that the rule was missed; missed savings shows what the miss cost, by carrier, corridor and business unit, which is what makes it usable in a negotiation.
What is lowest logical fare and why does it matter?
Lowest logical fare is the cheapest available fare that still meets policy and practical routing requirements. It is the benchmark against which above-fare bookings are measured. Without it, a programme can report total air spend but cannot say how much of that spend was avoidable, or which bookings to question first.
Can missed savings analysis run on the systems we already use?
Yes. Missed savings analysis is an analysis layer over the booking, card, expense, HR and finance systems already in place. Nothing gets migrated, travellers keep booking where they book today, and the analysis reads from consolidated feeds rather than requiring a new system of record.
What does missed savings analysis give procurement before a negotiation?
It gives procurement the realised-versus-contracted figure for each carrier and corridor before the negotiation opens. Invoice data shows what was bought; missed savings shows what should have been bought at the rate already negotiated, and which routes justify reopening the contract now rather than at the next annual sourcing cycle.
How long does a missed savings analysis take?
By hand, it takes weeks: a single policy simulation runs to two to three weeks of analyst work in a mid-to-large enterprise, on PredictX's step-by-step estimate. With agentic analytics it takes seconds. The time saved comes from the join, because booking data, fare benchmarks, contract terms and policy parameters no longer need three teams to coordinate.
Where to start with missed savings analysis
Missed savings is a measurable gap across four leaks. A programme that cannot state its figure is usually held back by the join, because booking data, fare benchmarks, contract terms and policy parameters have taken longer to bring together than the fares stay bookable.
Ask one missed savings question your current travel and expense reporting cannot answer today. Pick a corridor, name a threshold, and send us the question.
Related Posts
T&E Policy Simulation Calculator: Model Policy Changes Before You Commit

Before the RFP: Using Cogent Agentic AI to Decide Which Vendors to Contract Next

Vendor Negotiation Intelligence: How Enterprise Travel Teams Stop Negotiating Blind